Preprocessing
Preparing the geometry required for solving the transport physics involves conversion of the 3D vascular geometry into a weighted graph. The format for specifying topology information of the vascular network is found in input.xlsx. The specifics of the column fields provided in the spreadsheet are detailed below.
Step 1: Preparing the input geometry
The reconstructed 3D volume of the microvasculatue is translated into a graph represented by nodes and edges (or vessel segments). Nodes represent terminal ends or junctions at which n-furcation of blood vessels occur. The edges are oriented in the direction of flow and each edge is formed by a tail (t) and head (h) node. The inputs required to form the weighted graph are:
Example:
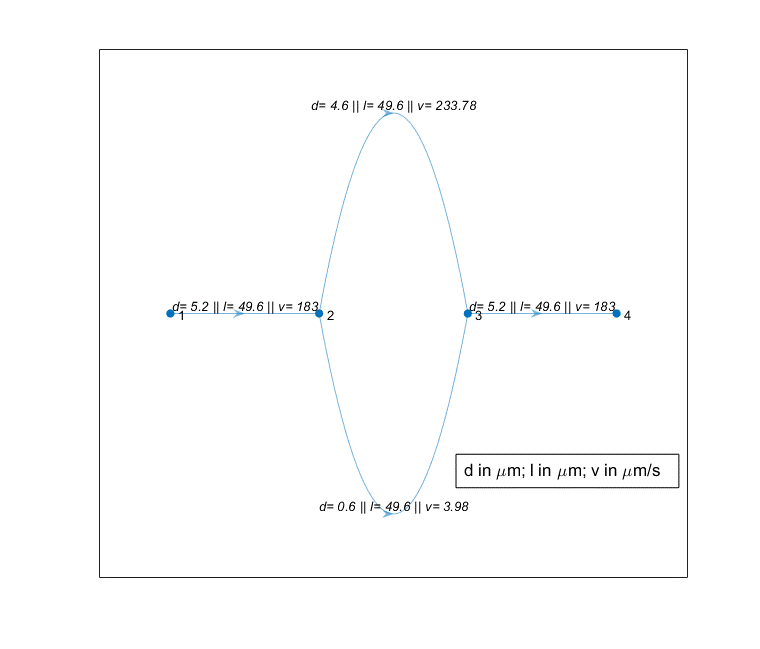
Here, 1, 2, 3, and 4 are the nodes labels. (1,2), (2,3), (3,4) are the edges.
The following 11 fileds are the column headers present in the spreadsheet. These values in these fileds are extracted from the skeletonized version of the vascular geometry.
t - tail
h - head
r - radius of the vessel segment formed by (tail, head)
d - diameter of the vessel segment formed by (tail, head)
l - length of the vessel segment formed by (tail, head)
xpos - x-coordinate of a node
ypos - y-coordinate of a node
zpos - z-coordinate of a node
nodes(index) - index/numbering of the graph nodes
hNode - inlet node at which fluid enters the domain (e.g. 1)
tNode - outlet node at which fluid leaves the domain (e.g. 4)
Step 2: Discretizing graph domain
nodes_mesh - index/numbering of nodes in the discretized domain
xpos_mesh - x-coordinate of nodes in the discretized domain
ypos_mesh - y-coordinate of nodes in the discretized domain
zpos_mesh - z-coordinate of nodes in the discretized domain
segment_i_nnode - no of intermediate(i) nodes between each head and tail nodes in the a given segment. e.g if 2 nodes (labelled 5 and 6) are added between (1, 2) segment_i_nnode=2.
volume_ratio and other extras (computed internally, not user defined)
The topology data of four vasculatures studied in our work are available in the workbooks of the input file. For carring out simulations with new vasculatures, add a workbook and populate the topology information corresponding to the 11 fields mentioned in Step 1. Next, generate the data of the first 5 column fields mentioned in Step 2 via read_mesh.py which discretizes the domain using Gmsh library. read_mesh.py generates the coordinates of the mesh elements making use of the minimum and maximum bounds of element size specified by the user. Copy the output saved in data_model.xlsx and update the coordinate information of the discretized domain in the input spreadsheet prior to simulation. The data is read from the input file by the executable main.exe and the computational domain is created for proceeding with the static and dynamic simulation runs